A downloadable video course. Not a live webinar.

Watch It At Your Own Pace, As Many Times As You Like. Your Own Personalised Copy.

The Market Has A Shape.
Learn To Measure It.

Time tells you when the market keeps its appointment.

Geometry tells you where it goes once it has arrived.

Most traders are working with one half of a pair

and wondering why the chart keeps making fools of them.

Hand-drawn sketch of a steam train at a station platform, with a second train pulling away along a curving track

Nobody Catches A Train With Half A Timetable

The 6:40 leaves from platform three.

Know the time but not the platform, and you hear it pull out.

Know the platform but not the time, and you stand there watching an empty track.

A market turn asks you for exactly the same two things.

Time tells you the 6:40. Geometry tells you the platform.

And the platform is the half almost nobody is taught.

YES!! I Want To Measure Where Price Goes After The Turn.
Send Me Market Geometry Now!

₹9999.00 (India)  ·  US$ 119 (International)  ·  your own personalised copy within 48 hours

The Thing That Changed How I Read A Chart

For years I did what everybody does. I drew a line between two points that looked important, extended it forward, and treated where it landed as information. Sometimes it worked. When it did not, I had no way to tell whether the idea was wrong or my two points were.

That is not a method. That is a habit with a ruler in its hand.

What changed it was a very ordinary realisation, and I am almost embarrassed by how simple it is: price and time are printed on the same chart in two different units, and nobody ever converts between them. The vertical axis is rupees or dollars. The horizontal axis is days. We draw a diagonal across the two and call it an angle — an angle between a currency and a calendar, which is a meaningless quantity.

Fix the units, and the angle stops being decoration.
It becomes a measurement.

Cartoon of Anant Acharya leaning back at his desk with his feet up

Not a new indicator. Not a signal service.

A different instrument, aimed at a question your tools cannot answer.

Not when, but how far.

Three Things You Are Almost Certainly Wrong About

Not because you were careless. Because this is what everybody is taught.

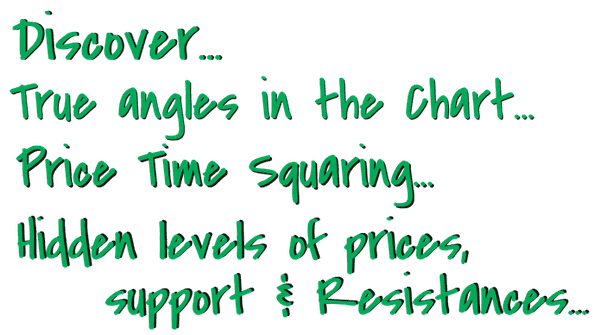
Hand-lettered list: true angles in the chart, price time squaring, hidden levels of price, support and resistances

Why The Angle On Your Chart Is Meaningless
Until You Fix Both Of Its Ends

Every trader knows a trendline needs two points. Almost nobody is taught how those two points are chosen — so they are chosen by eye, which means the line is an opinion wearing the costume of a measurement.

There is a rule for it.

Once you have the rule, your lines stop being debatable.

Why This Is A Calculator's Job,
Not A Mathematician's

People hear “geometry” and assume they are about to be out of their depth. The arithmetic here is addition, multiplication and a square root.

What takes the effort is understanding why you are doing it — and that is a matter of sitting through an explanation, not of being good at maths.

If you can use a calculator, you can do this.

Cartoon of Anant Acharya riding a motorcycle
Cartoon of Anant Acharya at a desk of trading screens

Why You Never Need To Pay A Monthly Fee
To Draw A Single One Of These Lines

The industry's answer to every problem is a subscription. This method runs on any free charting program you already have open.

I am not interested in selling you a tool you must keep renting, or in building you a method you cannot run without me.

The method stays yours after you own it.

YES!! I Want To Measure Where Price Goes After The Turn.
Send Me Market Geometry Now!

Two Halves Of One Instrument

This is why Market Geometry exists as its own course, and why it is the natural next step after the timing work.

Time — when

The market keeps appointments. Timing work tells you which day to be paying attention, and it is remarkably good at it.
What it will not tell you is what happens after the bell rings.

Space — where

Once the turn has happened, geometry measures the move it is likely to make: how far, to which level,
and the point at which the structure says the move is complete.

What is in the Market Geometry Video course?

Everything That Comes With It

The full video course, downloadable All three geometry methods, built from first principles. Yours to keep, watch as often as you like. core
Your own personalised, encoded copy Built for you after you order. Your details are inside the file itself. included
GST tax invoice Raised automatically in the GST-registered name, Anant J Acharya. included
Automated TradingView tools, three months Three months of access to the automated tools, on the TradingView platform you already use. included

This is an actual Video recording of a 6.5 hour Webinar presented by Anant in 2023. Not only are the concepts listed covered, but Anant has shown many simpler and short cut methods of applying the material. Also includes an extensive Q&A session and you will find many more methods of practical application.

It is Pure Gold for a Trader / Investor

One payment. No subscription. No second thing to buy afterwards.

₹9999.00 (India)·US$ 119 (International)

How Your Copy Reaches You

Delivered exactly the way the Timing Financial Markets video course has been delivered since 2022.

1

You order, and give your name, email and phone number.

2

Your copy is built — your details encoded into the video itself.

3

A download link reaches your inbox within 48 hours.

4

The link stays live 72 hours. Save the file and it is permanently yours.

Why personalised? Because a course that took two decades to assemble should not spend its first week on a file-sharing site. Your copy carries your name inside it — which is the reason the price can stay where it is instead of being set to cover the theft.

YES!! I Want To Measure Where Price Goes After The Turn.
Send Me Market Geometry Now!

₹9999.00 (India)  ·  US$ 119 (International)  ·  your own personalised copy within 48 hours

Look At What Earlier Students Had To Say…

Read what they actually talk about. It is never a number — it is how they look at a chart now.

Shashank Gupta

Shashank Gupta

“Earlier I used to look at the market as a collection of price movements. Today I see patterns, cycles, structure and probabilities. I would get influenced by every market move. Today I am much more comfortable sitting out when my setup is not there. I wanted to know what will happen. Now I focus more on understanding what the market is telling me.

Click any message to read it in full. Phone numbers and names are blacked out — the originals are held on file.

By now, you're probably thinking...

If it is so accurate, why am I bringing it out into the open?

The simple answer is, sharing my knowledge and my research is like cocaine for me. It gives me a rush, that heady feeling that you get, when your trades go perfectly, and you see that ton of money. Nothing else matters than that feeling. Seeing your account grow, seeing you are right and being rewarded handsomely for your efforts. I go through the same feeling too.

Every time, I open my e-mail and I see mails from students like you, from every corner in the world, writing, how they succeeded.

Yes! Your success is important to me and your feedback is my greatest reward.

This must be very complicated.
You have not seen or heard of anyone able to do this!

If you can draw a trendline on the chart, I will show you exactly what to draw, why to draw, and most importantly how to read it.

Even a 10 year old child can do it. You just need to know the principles.

Do I need expensive softwares and expensive data solutions?

The greatest software on earth rests on your shoulders. Its free for you and only you.

You need no other software. You can apply these principles, using any and all of the free charting programs that are available on the internet today.

I am NOT interested in selling you any software, that you need to pay for every month!

Nor am I interested in selling you something that will make you dependent on me.

Do I have the time to learn this?

Let me ask you, do you have one weekend free?

If the answer is yes, then before the beginning of next week, you will not only be forecasting the future trend changes, but you will also be able to take trades with ease.

Imagine what it will do to your trading and investing. You will not only gain a lot of free time, free time that you can spend with your family, with your friends or wth your girl friend, but also gain the confidence to trade the markets with ease.

You are a long term investor. Is this knowledge of time of any use to you?

If you are a long term investor, you can forecast Future trend changes that will last weeks and months. You can trade with confidence, calm and hold positions till the entire move plays out. The process removes the fear of missing out and gives you the luxury of planning your investments over longer periods.

You are an Intraday Trader. Will this course help you?

If you are a day trader, then this course will meet almost all your expectations. Think about it. In all your life, nobody has told you ever that Indices behave differently from stocks & commodities. Your entire approach to day trading will change and change for good, as soon as you realize the different approaches we need to take for trading different instruments and different time frames. You will not only know when, but also where the next trend changes can be expected. It will also remove the fear of wondering, if the market is turning every minute intraday.

You are an Swing Trader?

If you are a swing trader, then you can use the same knowledge and the same systems to forecast the markets on hourly charts, daily charts and take trades that last from 3 days to a week and more.

Should You spend money on one more course?

How many times have you gone to the coffee shop or a restaurant and ordered, a new flavour, a new dish, without knowing what you are actually getting? And once you see the dish or relish the flavour, you now want to have nothing else.

You would not have known unless you gave it a try.

Many things in life are such, unless you are willing and open to try something new, you will never change or improve your life. You want to improve your trading, you want to get better results, you want to see greater profits, you want to feel financially free and all these changes will only come in, when you change something that you are not doing right today.

Here is one of the best opportunities for you.

Maybe you will study the course later, during your holidays
or that big break you are planning?

Think about it.

What is the value of just one trade tomorrow that you should have avoided, but did not.

What is the gain you make next week on just one trade, with the knowledge of time.

Every trade you take without knowledge of time & space has an inherent ability to mislead you.

Time is the most precious commodity in the universe. Each one of us only has a finite supply of time. The more you delay, the more you postpone, the lesser your chances of making those winning trades at the right time.

If he can do it, You can also research and study the markets.
Why do you need to pay?

Yes! You can do it. Anyone can do the research.

But remember, it took me about 12 long years of research and almost a decade of testing to formulate the principles and simplify the methods. You can get a jumpstart in your trading and begin to use the principles and methods from next week.

Are you willing to put the time and effort required for the research and understanding? Do you have a decade to delay?

We all have our reasons for not taking an action. But, think about it. All reasons and excuses are only ways to satisfy ourselves.

We are so scared to change the present, even if the present situation is tough and difficult. The only reason, we continue in our present situation, is because we were at some point unwilling to take that jump into uncertainty and work for something better. Will you do it again today? I certainly hope not, because, I know how much value the understanding and ability to time events makes to your life.


What I Am Not Going To Tell You

I am not going to tell you what this will do to your account, because I do not know and neither does anybody else who is being straight with you. There is no figure on this page for a reason.

What I will tell you is exactly what you are buying: a method of measurement, taught completely, that you can check line by line. It is arithmetic and geometry applied to a chart. It either measures what I say it measures — and you will be able to verify that yourself, on your own charts, within a week — or it does not.

That is the honest version, and after thirty years in these markets it is the only version I am willing to put my name to.