Imagine you are in a giant toy store.
People buy and sell toys all day long.
Some days, everyone wants a red toy car.
Because everyone wants it, the price goes up.
Other days, nobody wants that red toy car.
Then, the shopkeeper makes the price go down.
In the stock market, people buy and sell shares of companies.
A share is a tiny piece of a real company.
Price changes every single second of the day.
It moves up and down like a bouncing rubber ball.
Looking at this bouncing ball can make your head spin.
This is where technical analysis comes in.
Technical analysis is like reading footprints in the snow.
If a giant bear walks in the snow, it leaves deep tracks.
By looking at the tracks, you know where the bear went.
You can also guess where the bear might walk next.
On your computer screen, price leaves tracks too.
These tracks form a picture called a chart.
A chart shows squiggly lines that jump around.
Sometimes, the lines look like crazy scribbles.
It is very hard to understand crazy scribbles.
So, smart traders use special helper tools.
We call these helper tools indicators.
Let us learn why we use them.
Let us also learn why we really need them.
                       THE CRAZY PRICE LINE
Price
  ^
  |            /\              /\
  |   /\    /   \    /\    /   \    <-- Jumping like a wild monkey!
  | /   \ /       \/    \/       \
  +------------------------> Time

                       THE SMOOTH HELPER LINE
Price
  ^
  |            .-------'    <-- A moving average indicator!
  |        .--'                 It shows the real path clearly.
  |    .--'
  +------------------------> Time
Part 1: Why Indicators Are Used in Technical Analysis
Why do traders put these math helpers on their screens?
There are five big reasons.
Let us look at each reason, step by step.
1. To Make the Bumpy Road Smooth
Imagine you are riding your bicycle down a path.
The path is full of tiny stones and dirt.
Every time you hit a tiny stone, your handlebars shake.
Your front wheel bumps up and down constantly.
Does this mean the whole street is broken?
No, it does not.
The street is fine; it just has small pebbles.
The stock market has pebbles too.
Every second, someone buys or sells a few shares.
This makes the price twitch up and down quickly.
We call this twitching market noise.
Market noise is like a fly buzzing near your ear.
It distracts you from the big picture.
An indicator called a Moving Average fixes this problem.
The computer adds up the prices from the last twenty days.
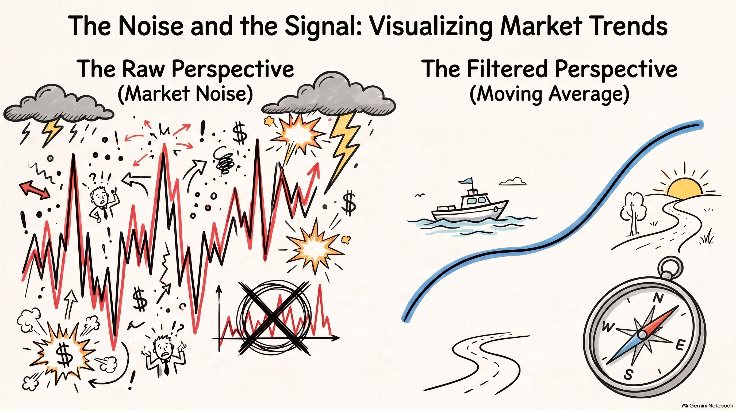
Then, it finds the middle price for those days.
It draws a gentle, smooth line across the screen.
This smooth line ignores the tiny pebbles.
Now, you can see the real road.
You can see if the road climbs up the mountain.
Or, you can see if the road slides down into the valley.
That is why we use indicators: they clean away the dirt!
2. To Measure the Speed of the Move
Imagine you are running a race at school.
You hear the whistle blow: Tweet!
You sprint as fast as your legs can carry you.
Your heart beats very fast.
After one minute, you begin to feel very tired.
Your legs feel heavy like bags of wet sand.
You are still moving forward towards the finish line.
However, you are running much slower than before.
Anyone watching you can see the truth.
They know you will have to stop soon to breathe.
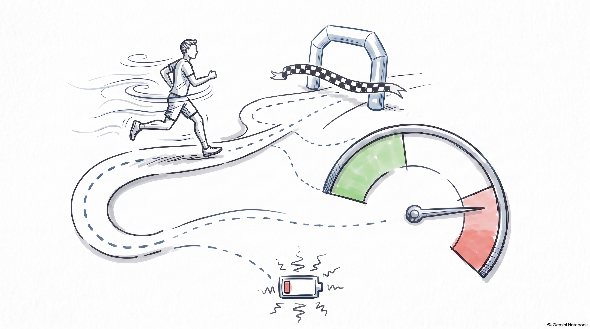
Prices on a chart do the exact same thing!
A price can climb higher and higher like a rocket.
To a beginner, this rocket looks totally unstoppable.
They say: "Look! It is going up! Buy it now!"
However, a smart analyst checks a speed indicator.
One famous speed tool is called the RSI.
RSI stands for Relative Strength Index.
The RSI acts like a heartbeat monitor for price.
It tells us how fast the price is running.
Sometimes, the price goes up, but the heartbeat gets weak.
The indicator warns us: "Be careful! The runner is tired!"
Soon, the tired price will stop and rest.
Without this tool, you cannot see how tired the move is.
Indicators show us the secret engine under the hood.
THE TIRED RUNNER STORY:

Price:       $10 ---> $20 ---> $30 ---> $31 (Still going up, but barely!)
Energy (RSI): 90  --->  75 --->  50 --->  30 (The runner is running out of air!)
                                          ^
                                          |
                              DANGER! A drop is coming soon!
3. To Turn Messy Numbers into Easy Scales
Think about measuring two different animals.
Imagine you have a giant blue whale in the ocean.
You also have a tiny pet hamster in a cage.
A whale weighs thousands and thousands of heavy kilograms.
A hamster weighs only a few light grams.
Can you compare their weights directly?
No, that would be very confusing and silly.
Stocks are just like whales and hamsters.
One big company might cost three thousand dollars per share.
A small company might cost only five dollars per share.
If both stocks move up by two dollars, what happened?
For the big stock, two dollars is nothing.
It is like a single drop of water in an ocean.
For the small stock, two dollars is a giant leap!
It grew by nearly half its entire size!
If you only look at raw numbers, your brain gets tired.
Indicators solve this by using a fixed scale.
Many indicators squash all numbers between zero and one hundred.
Think of a school test score.
A score of zero means you answered nothing correctly.
A score of one hundred means you got every answer right.
An indicator score of eighty always means the same thing.
It means buyers pushed very hard, no matter the stock price.
It lets you compare a whale company to a hamster company easily!
4. To See If Big Players Are Helping
When you push a toy boat in the bathtub, it moves.
Your finger makes a tiny splash in the water.
Now imagine a huge real ship sailing across the sea.
The ship moves thousands of gallons of deep water.
In the stock market, you are like the tiny toy boat.
You trade a small amount of money from your piggy bank.
Big banks and funds are like giant ocean ships.
They trade millions of dollars every single minute.
If price moves up, you must ask an important question.
Did a tiny toy boat push the price up?
Or did a giant ocean ship move the price?
If only small buyers pushed it, the move will fail.
If giant banks pushed it, the move can go very far.
We use volume indicators to solve this puzzle.
One famous volume tool is called VWAP.
Another tool is called On-Balance Volume.
These tools count the total number of shares traded.
They show us the hidden giant ships in the water.
They tell us if big money is joining the party.
5. To Measure How Wild the Market Is
Have you ever watched the weather change outside?
Some days are quiet, warm, and sunny.
The leaves on the trees barely move at all.
You can play outside with a light paper kite.
Other days, a wild storm blows through town.
Wind howls, rain crashes, and branches break on trees.
You would never fly a paper kite during a hurricane!
The market has sunny days and storm days too.
Sometimes, the price stays very calm for weeks.
It barely moves up or down by a single penny.
Other times, the price swings wildly like a loose rope.
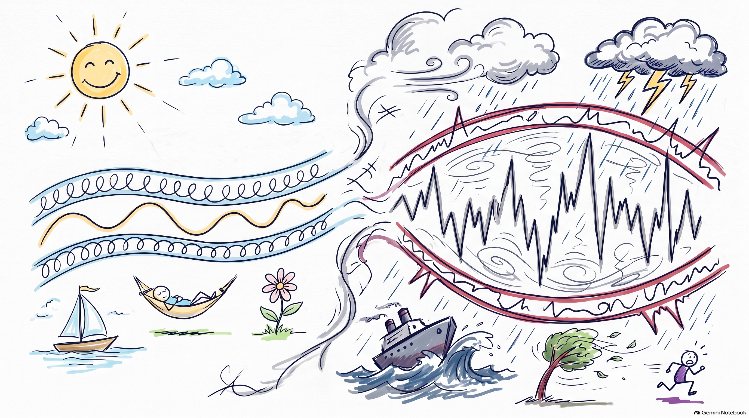
An indicator called Bollinger Bands measures this wildness.
Bollinger Bands look like two rubber bands around the price.
When the market is quiet, the rubber bands squeeze tight.
When a storm hits, the rubber bands stretch wide open.
When the bands squeeze tight, an expert knows a secret:
A big storm is getting ready to explode soon!
Indicators tell you whether to bring an umbrella or sunglasses.
                     BOLLINGER BANDS AT WORK:
Price
  ^
  |        Upper Band (Rubber Band)
  |       ----------------------------.
  |                                    \
  |  ~~~~ Quiet sleeping price ~~~~     \  <-- SQUEEZE!
  |                                     /
  |       ----------------------------'
  |        Lower Band (Rubber Band)      \
  |                                       \---> BOOM! Price explodes!
  +---------------------------------------------> Time
Part 2: What Is the Need of Indicators?
Now you know why indicators work.
Next, we must answer a deeper question.
What is the true need for them?
Why can we not just guess with our own eyes?
Why do we truly need these math tools to survive?
Here are the big reasons why indicators are necessary.
1. To Protect Us from Our Own Feelings
Trading is one of the hardest games on Earth.
It is not hard because of math.
It is hard because humans have strong feelings.
Two giant monsters live inside every human trader:
The first monster is named Greed.
The second monster is named Fear.
Let us see how the Greed monster tricks you:
You see a stock price climbing up very fast.
Green bars flash brightly on your computer screen.
The Greed monster whispers in your ear:
"Look how fast it is going! You are missing out! Buy now!"
So you click the buy button at the very highest point.
Then, the price suddenly crashes down!
Now, the Fear monster jumps out and shouts:
"Oh no! You are losing money! Sell right now before zero!"
You sell in a panic at the absolute bottom.
You lose your allowance because you listened to your feelings.
Here is the secret: Indicators have zero feelings.
A math indicator does not feel greedy.
A math indicator never feels scared.
It does not care if the screen is red or green.
It just does its math quietly in the background.
When you feel like chasing a stock, you look at your tool.
The tool says: "The market is too stretched. Do not buy."
The indicator is like a calm, wise teacher.
It stops you from doing silly things when you feel excited.
THE EMOTION TRAP:
Your Brain:    "I want to buy! Everyone is getting rich!" (Greedy Feeling)
Your Indicator: "Wait! RSI is 85! The price is overheated!" (Calm Math)

The Indicator saves you from making a huge mistake!
2. To Give Us Clear Rules for the Game
Think about playing a game of soccer with your friends.
What happens if there are no white lines on the grass?
What happens if there is no referee with a whistle?
Someone will kick the ball into the street.
They will scream: "Goal! I scored a goal!"
Another friend will shout: "No! That was out of bounds!"
Soon, everybody starts arguing and crying.
Without clear rules, you cannot play any game properly.
Trading without indicators is like playing soccer with no lines.
One day, you think a chart looks pretty.
The next day, the same chart looks ugly to you.
You change your mind every five minutes.
You cannot win a game if your rules change every day.
Indicators give you solid, unbreakable lines.
You can write down simple, clear rules like this:
Rule 1: Only buy when the price is above the blue line.
Rule 2: Never buy if the red line crosses below the yellow line.
Rule 3: Sell your shares when the indicator drops below fifty.
Now, trading becomes a real, fair game.
You do not guess anymore.
You just follow your rules like a smart scientist.
3. To Build a Safe Seatbelt for Our Money
When you get into a car, what is the first thing you do?
You pull the seatbelt across your chest and click it.
You do not expect the car to crash.
However, you wear the belt just in case something bad happens.
In trading, your money needs a seatbelt too.
We call this seatbelt a stop-loss.
A stop-loss tells the computer:
"If this trade goes wrong, sell it immediately. Save my money."
Where should you place your seatbelt on the chart?
If you put it too close, a tiny wave will hit it.
You will get kicked out of the trade for no good reason.
If you put it too far, you could lose too many coins.
An indicator called ATR solves this puzzle.
ATR stands for Average True Range.
ATR tells you how many inches the price normally jumps each day.
If ATR is two dollars, you know the price bounces two dollars normally.
So, you place your seatbelt four dollars away.
Now, normal daily bounces will not touch your seatbelt!
The indicator helps you build a safe shield for your piggy bank.
BUILDING THE SEATBELT:

Current Price:    $100
Normal Jump (ATR):  $2
Safe Stop Distance: 2 times the normal jump ($4)

Your Seatbelt Line: Put your stop at $96 ($100 minus $4).
Result: You stay safe from random bumps!
4. To Connect the Big Clock to the Small Clock
Look at a clock on the wall.
It has an hour hand and a minute hand.
The minute hand moves around quickly.
The hour hand moves very slowly.
Both hands tell the time, but in different ways.
Charts have different clocks too.
You can look at a 5-minute chart.
You can also look at a daily chart.
Sometimes, looking at a 5-minute chart is like looking through a tiny straw.
You only see one tiny bug on a leaf.
You cannot see the hungry bird sitting right above the bug!
Indicators help you connect the big clock to the small clock.
You can check a 200-day line on the daily chart.
If the daily line is climbing, the big tide is going up.
Then, you switch to your small 5-minute chart.
You use your speed indicator to find a great entry spot.
This is called multi-timeframe analysis.
It keeps you swimming with the big ocean current.
You will never get crushed by swimming against the tide!
5. To Check the Health of the Whole Team
Imagine you are watching a school basketball team play a game.
One boy on the team scores thirty points all by himself.
All the other four boys on the team cannot score any points.
They look tired, slow, and unhappy.
Does this team have a healthy, strong squad?
No! Only one star player is doing all the hard work.
If that one star boy twists his ankle, the whole team loses!
The stock market is just like that basketball team.
An index like the Nifty 50 or S&P 500 has many companies.
Sometimes, the big index line keeps going higher.
It looks like the whole market is winning.
However, under the floor, forty companies might be falling down!
Only three giant companies are holding the scoreboard up.
If you only look at the scoreboard, you get tricked!
We need breadth indicators to see the whole team.
A breadth indicator counts how many stocks are actually going up.
If the team is tired, the indicator sounds an alarm: Beep! Beep!
It warns you: "The stars are alone! Danger is coming!"
Indicators let you look beneath the surface to see the truth.
THE BASKETBALL TEAM LESSON:

Scoreboard:          Going up! (Looks like we are winning!)
Team Members:        4 out of 5 players are tired and hurt!
Breadth Indicator:   WARN! The team is too weak to keep winning!
Part 3: What Indicators Cannot Do (The Big Warning!)
Now, you understand why we use indicators.
You also understand why we need them.
However, before you touch a chart, you must remember three warnings.
Many adult traders forget these rules and lose their money!
1. Indicators Are Not Magic Crystal Balls
Some people think an indicator can see into the future.
They believe a green arrow means the price must go up.
This is completely wrong!
An indicator is calculated from past prices.
It looks at what happened yesterday and ten minutes ago.
Does the speedometer in your family car know where you are going?
No!
The speedometer only tells you how fast you are driving right now.
It cannot tell you if a dog will run across the road ahead.
Indicators report the past.
They describe the current weather.
They can never promise what will happen tomorrow.
Always remember: Price is the real king.
Indicators are just the king's faithful servants.
2. Do Not Spill Soup on Your Screen!
Sometimes, a beginner discovers indicators and gets too excited.
They think: "If one tool is good, ten tools must be ten times better!"
So, they add twenty different lines to their screen.
They put on five different speed tools.
They put on four different moving lines.
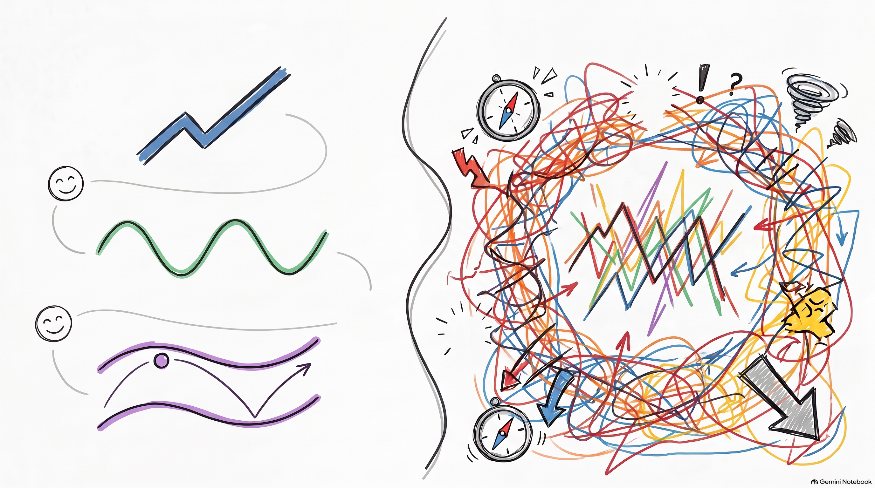
They add bands, dots, arrows, and flashing colors.
Their chart ends up looking like a bowl of spilled noodle soup!
One line says: "Buy!"
Another line says: "Sell!"
A third line says: "Do nothing!"
The trader gets totally confused and freezes like an ice cube.
We call this analysis paralysis.
Smart traders keep their charts clean and tidy.
They use only two or three helper tools:
One tool to show the road (Trend).
One tool to show the speed (Momentum).
One tool to measure the storm (Volatility).
That is all you need. Keep your screen simple!
THE MESSY CHART DISASTER:
Price Line:   [ ? ]  <-- Hidden behind 50 lines!
Tool 1:       Says BUY!
Tool 2:       Says SELL!
Tool 3:       Says WAIT!
Result:       Your brain explodes! Keep it clean!
3. All Indicators Are Slightly Late
Because indicators use past prices, they are always a little bit late.
Think about your shadow on a sunny day.
When you walk forward, your shadow follows behind you.
Can your shadow run ahead of you?
No, because your body must move first!
Price is your body; the indicator is your shadow.
Price must turn around before the indicator can turn around.
Do not get angry when an indicator is a little late.
That small delay is the price we pay for a smooth line.
Accept the small delay, and use it to confirm your plan safely.
Summary Checklist for a Young Analyst
Let us review everything we learned today:
+-------------------------------------------------------------------------------+
|                      THE YOUNG TRADER'S TOOLBOX CHEAT-SHEET                   |
+-------------------------------------------------------------------------------+
|  1. WHY DO WE USE THEM?                                                       |
|     * To smooth out the bumpy road and hide noisy pebbles.                    |
|     * To check the speed and heartbeat of the price runner.                   |
|     * To turn confusing prices into simple 0 to 100 scales.                   |
|     * To spot big institutional ships moving through the water.               |
|     * To measure how wild the weather storm is getting.                       |
+-------------------------------------------------------------------------------+
|  2. WHAT IS THE NEED FOR THEM?                                                |
|     * To stop the Greed and Fear monsters from controlling us.                |
|     * To give us clear, fair rules like the white lines in soccer.            |
|     * To help us strap on a safe money seatbelt (stop-loss).                  |
|     * To connect the big clock to the small clock.                            |
|     * To check if the whole team is healthy beneath the surface.              |
+-------------------------------------------------------------------------------+
|  3. THE GOLDEN RULES TO REMEMBER:                                             |
|     * Indicators are helpers, not fortune tellers.                            |
|     * Never cover your screen in messy noodle soup.                           |
|     * Price is always the king; indicators are just the helpers!              |
+-------------------------------------------------------------------------------+
Now, you have the secret wisdom of technical indicators.
You know how to read the footprints in the market snow.
Use your helpers wisely, follow your rules, and keep your piggy bank safe!